The Cities of AI Taxonomy
G2 has an extensive taxonomy of software categories, using Cinema 4D I designed an interactive chart to help G2 Investors analyze data about what AI categories are growing quickly and how many people are searching for them.
My Role: Design, Art Direction, 3D Design, UI/UX
Tools: Cinema 4D, Figma, Adobe Illustrator, Photoshop.
Problems
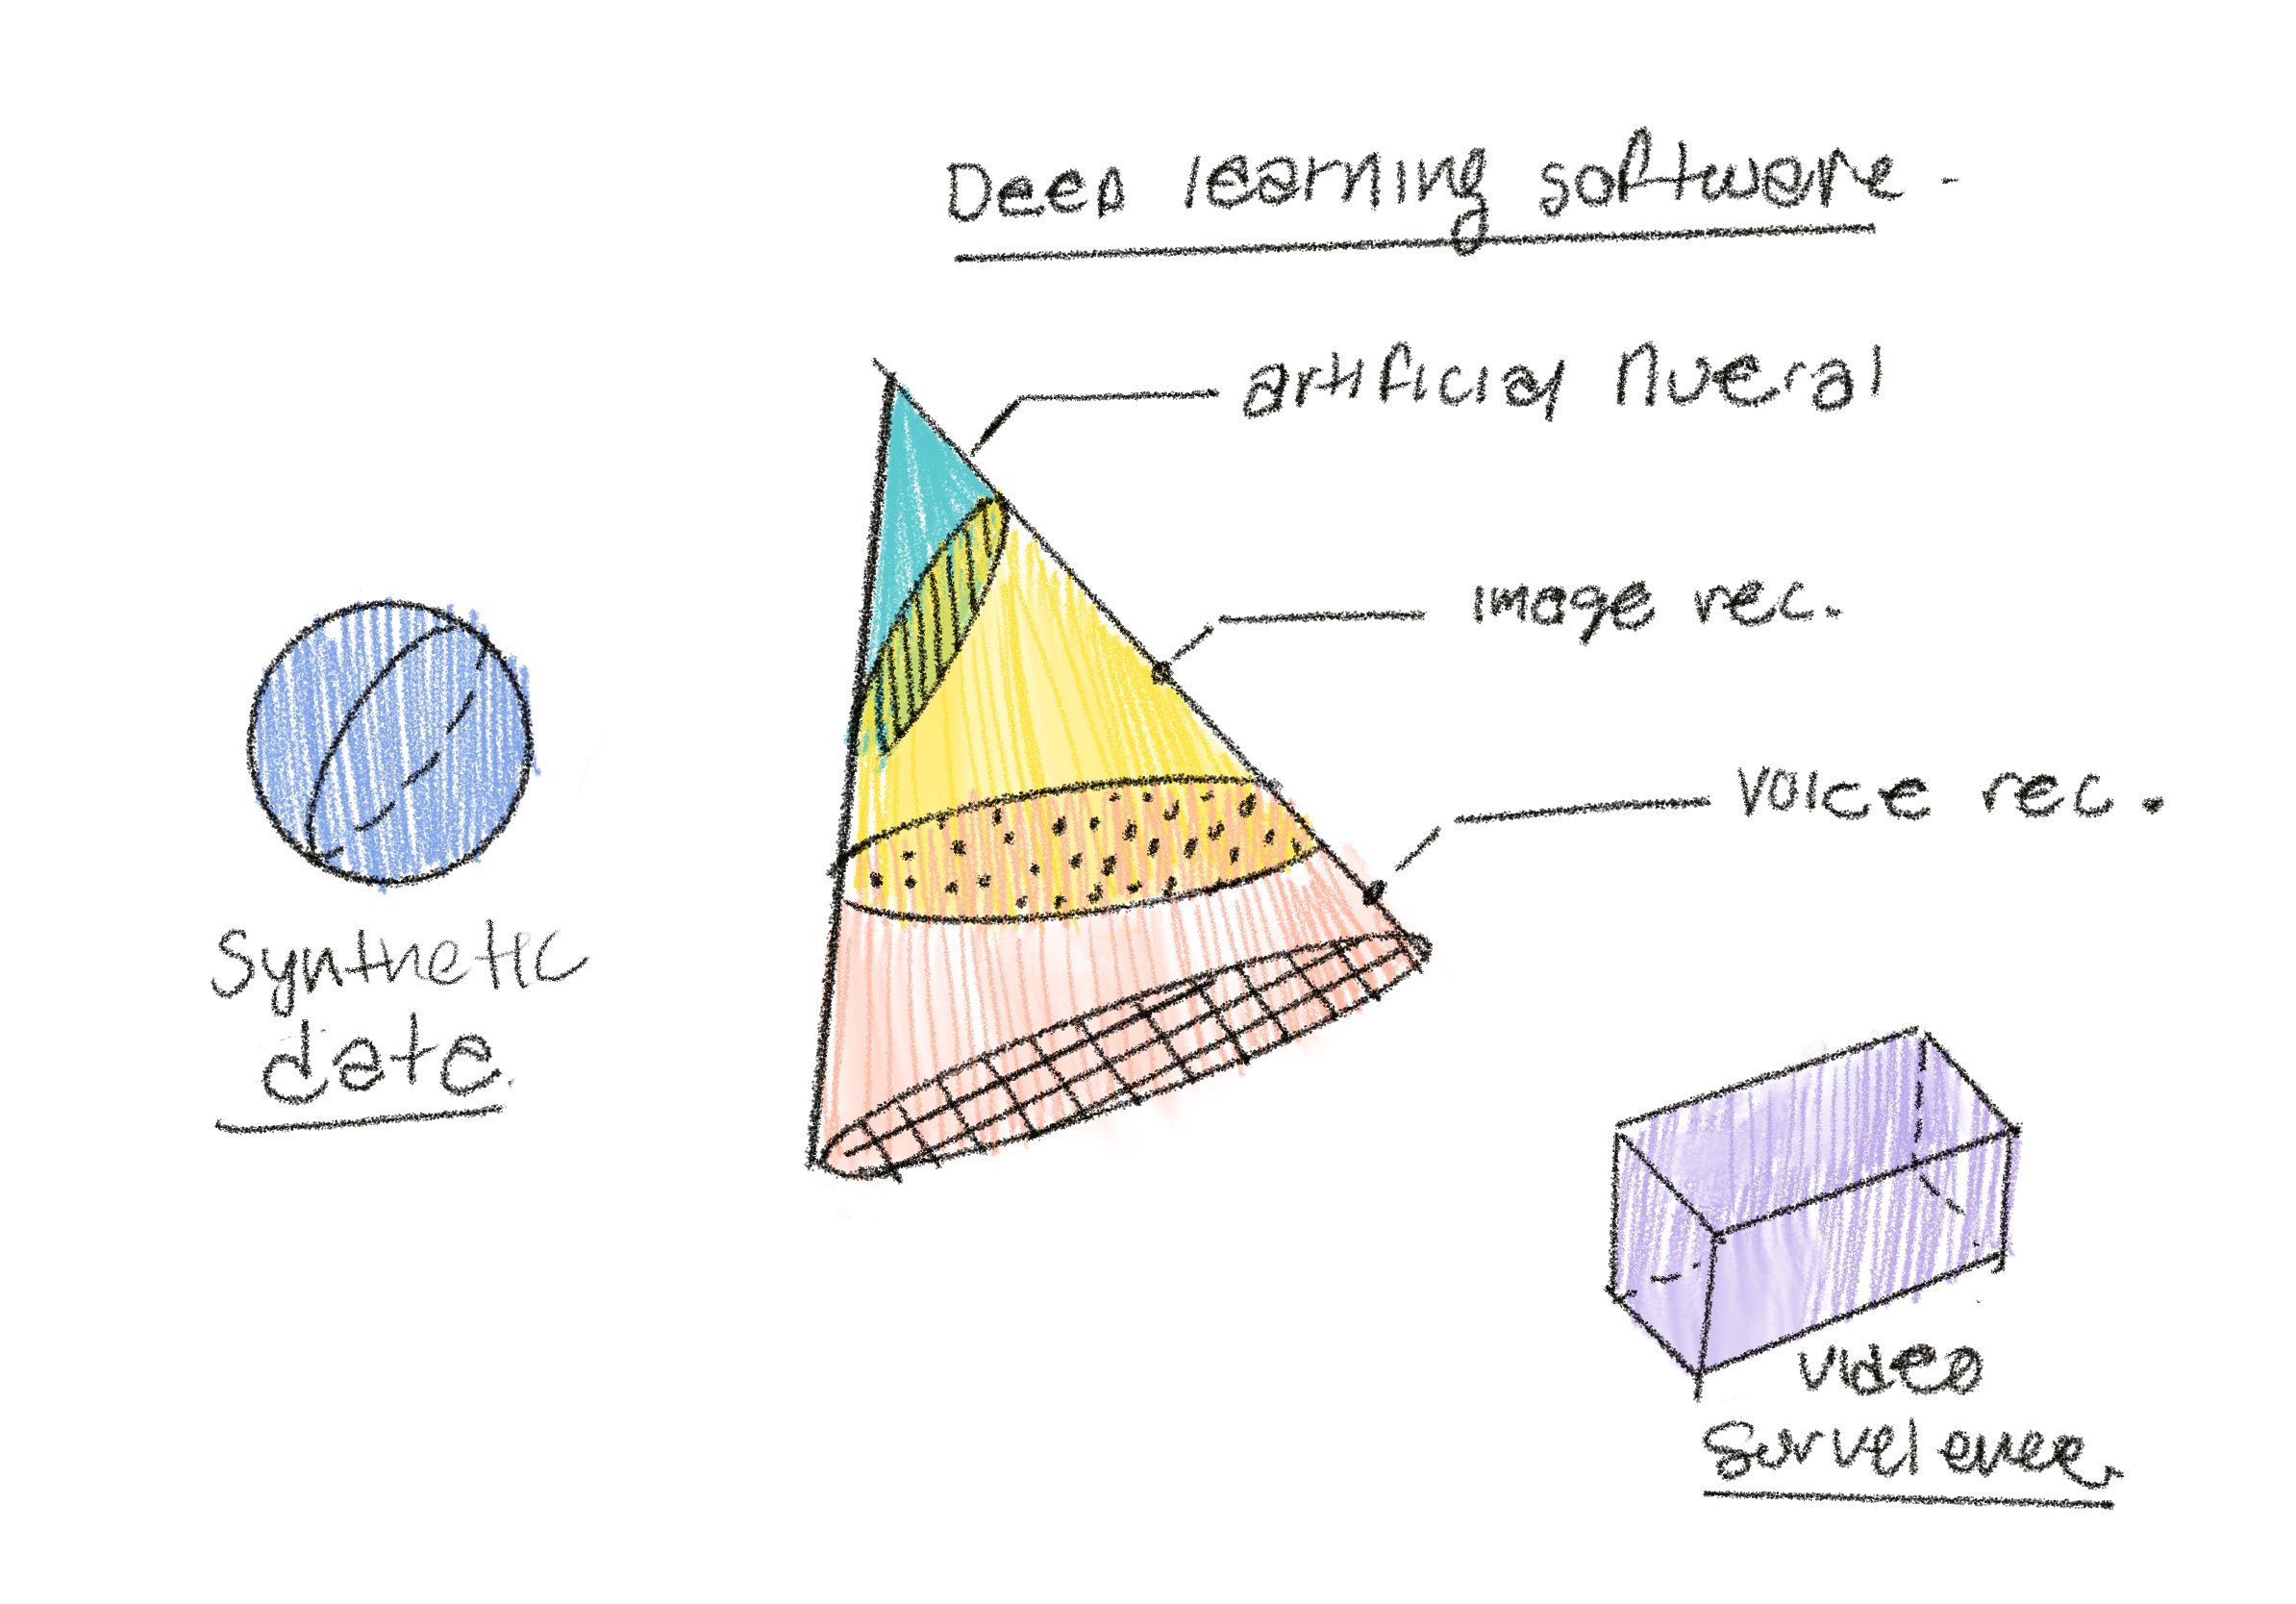
Create a way to visualize different groupings of AI categories that is more engaging than having them listed in a list.
How can we show multiple layers of information while still making each category distinct from one another?
How can we make the hierarchy relationship between parent and children categories obvious?
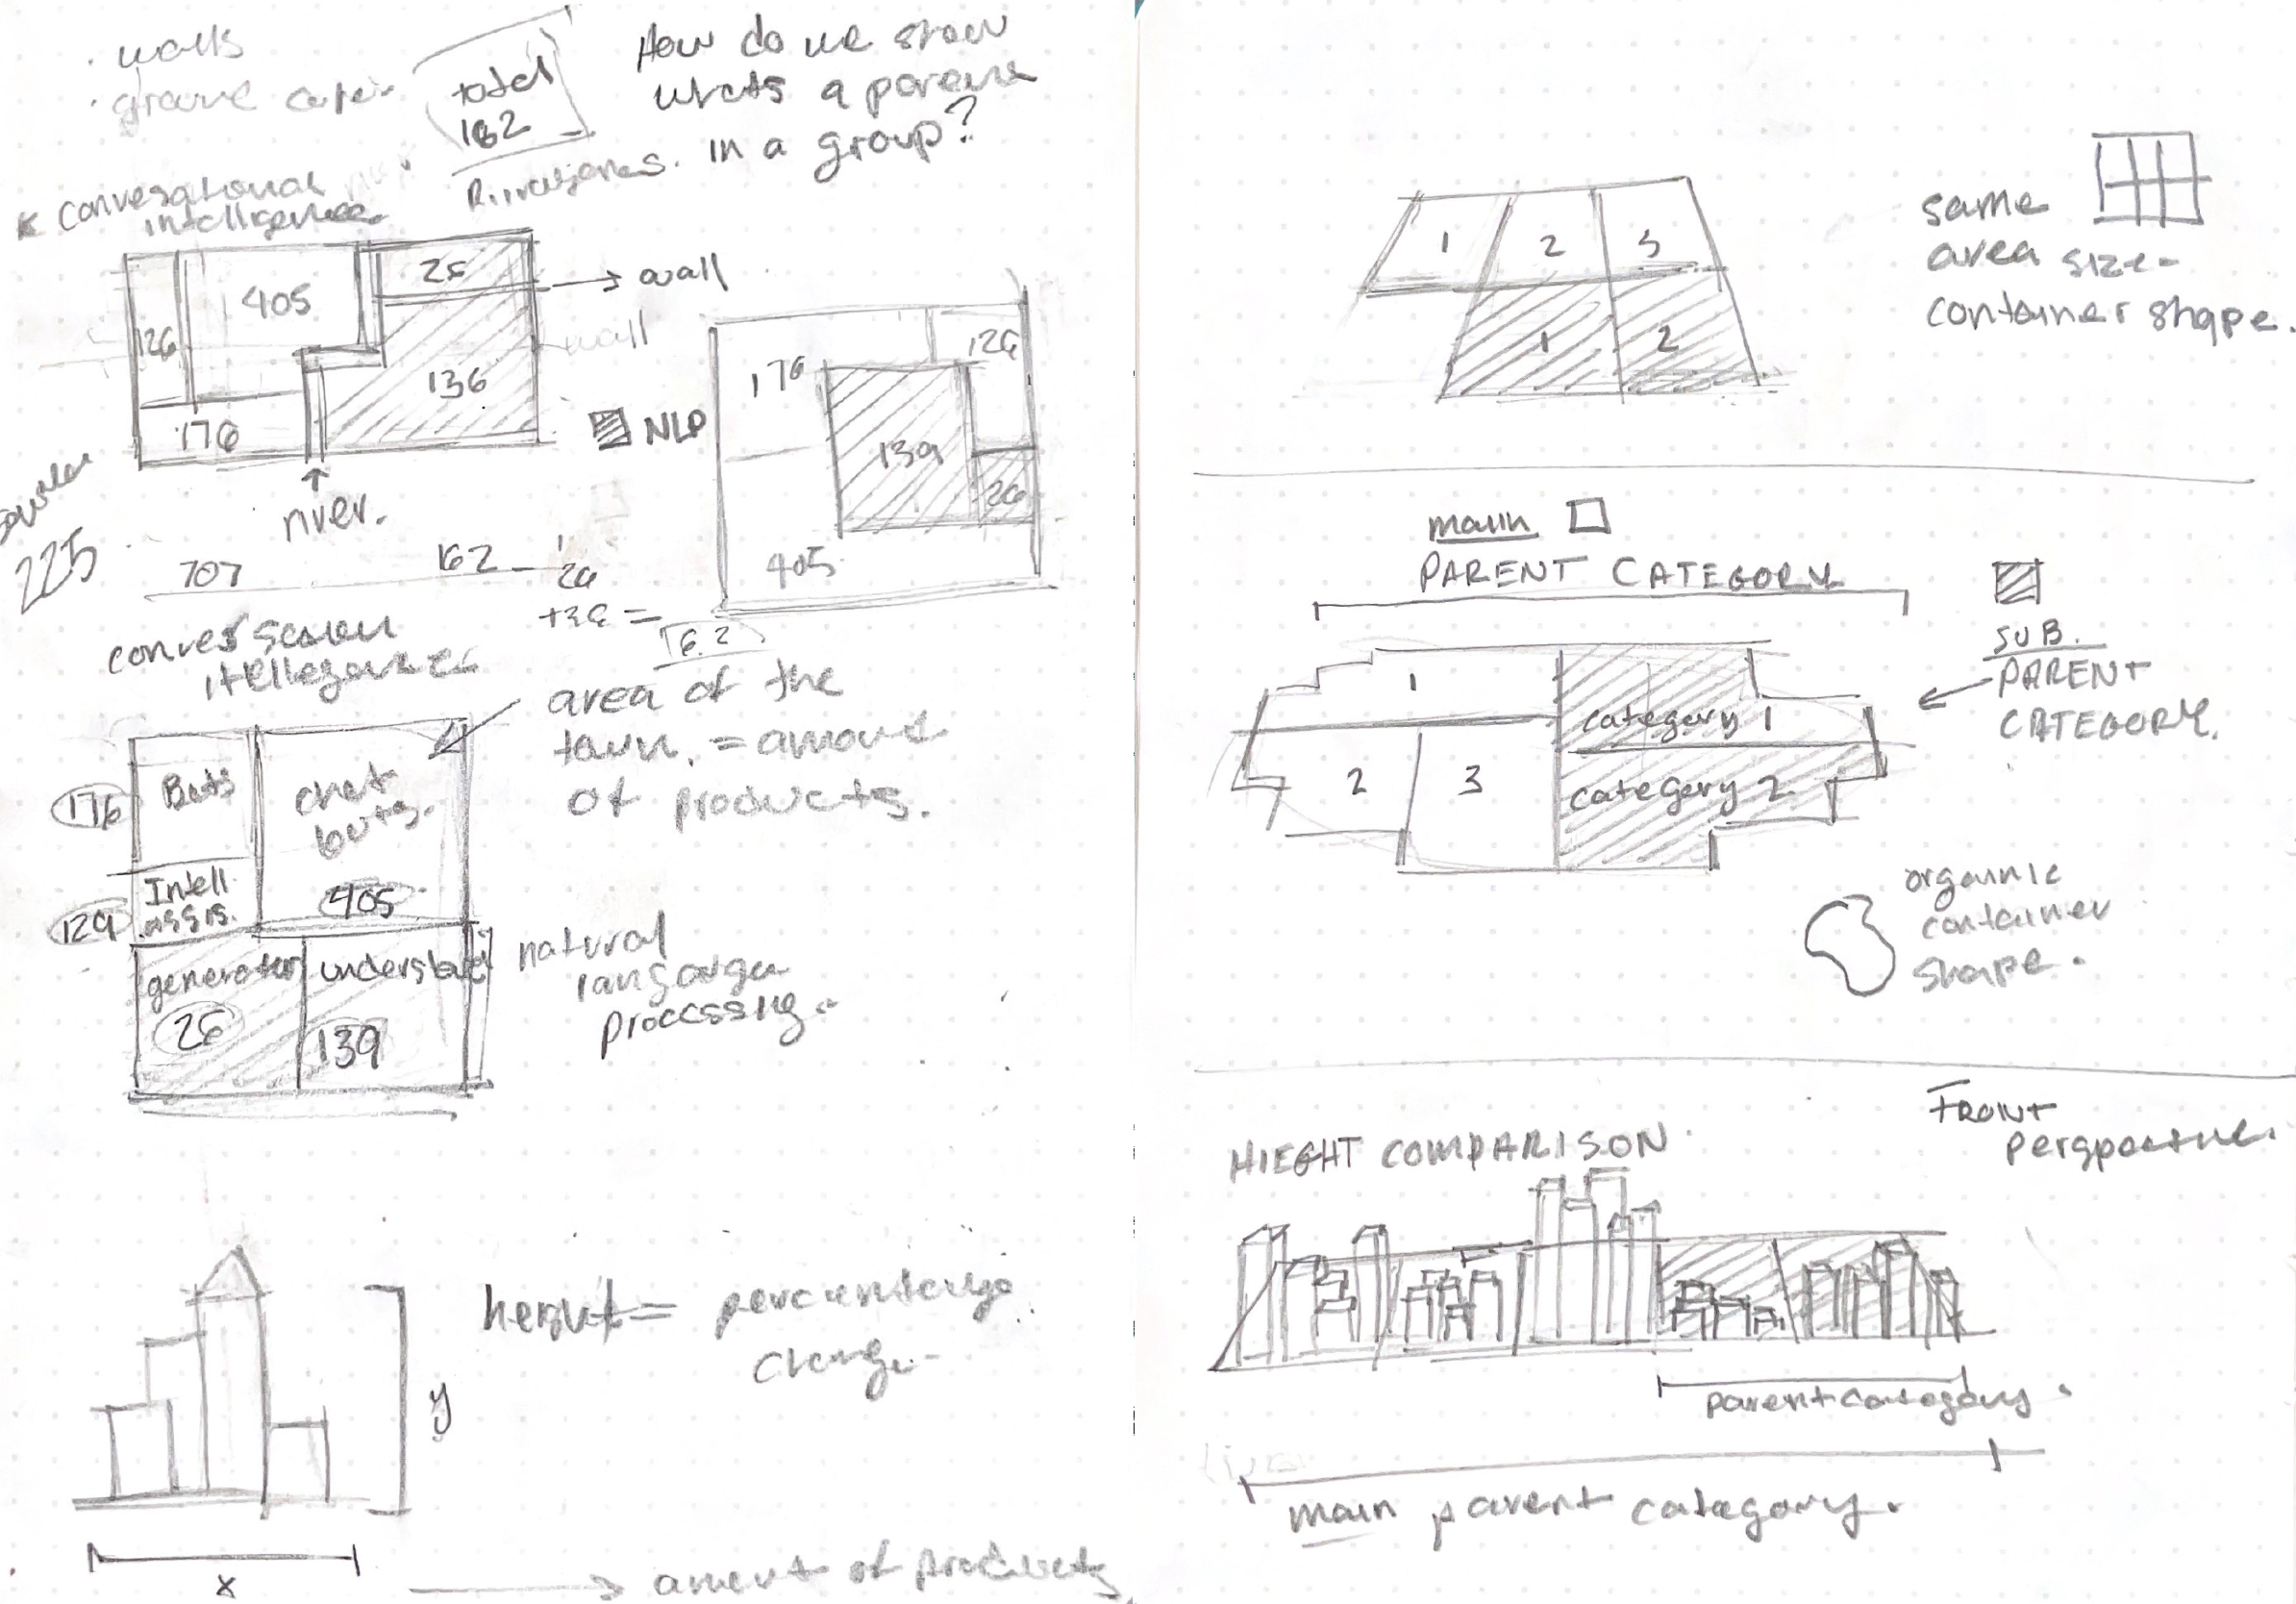
Designing a folder system
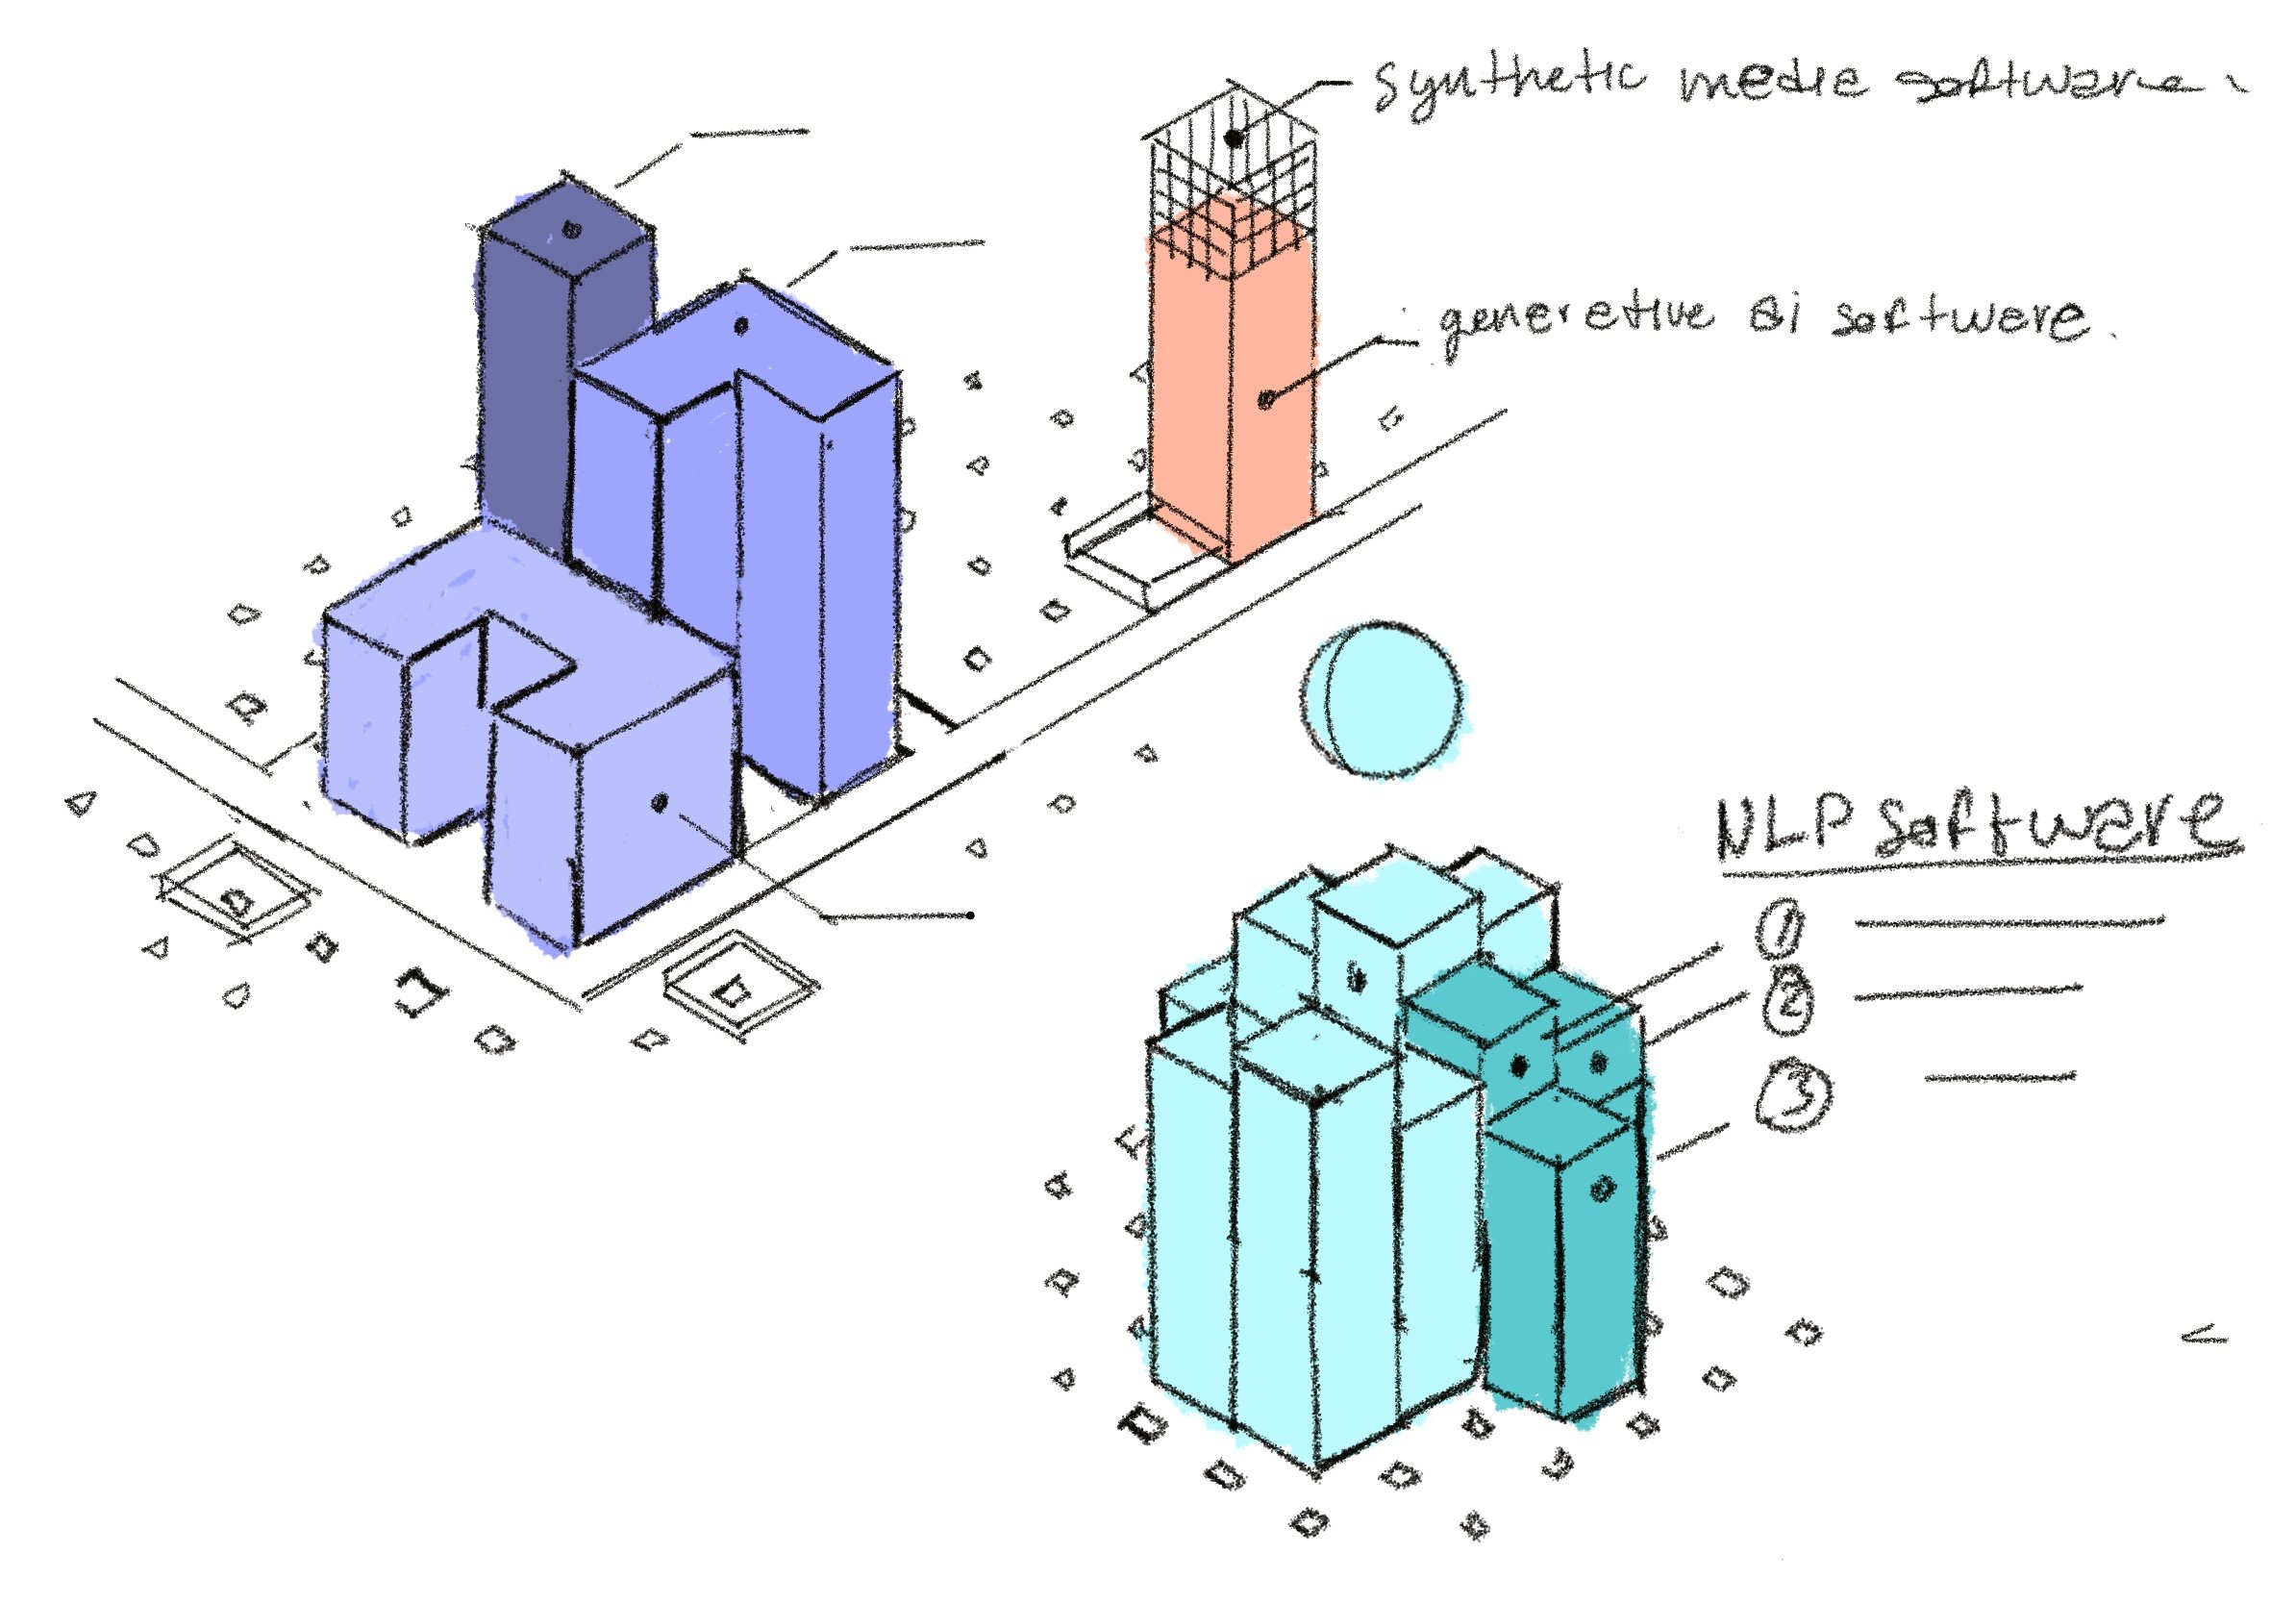
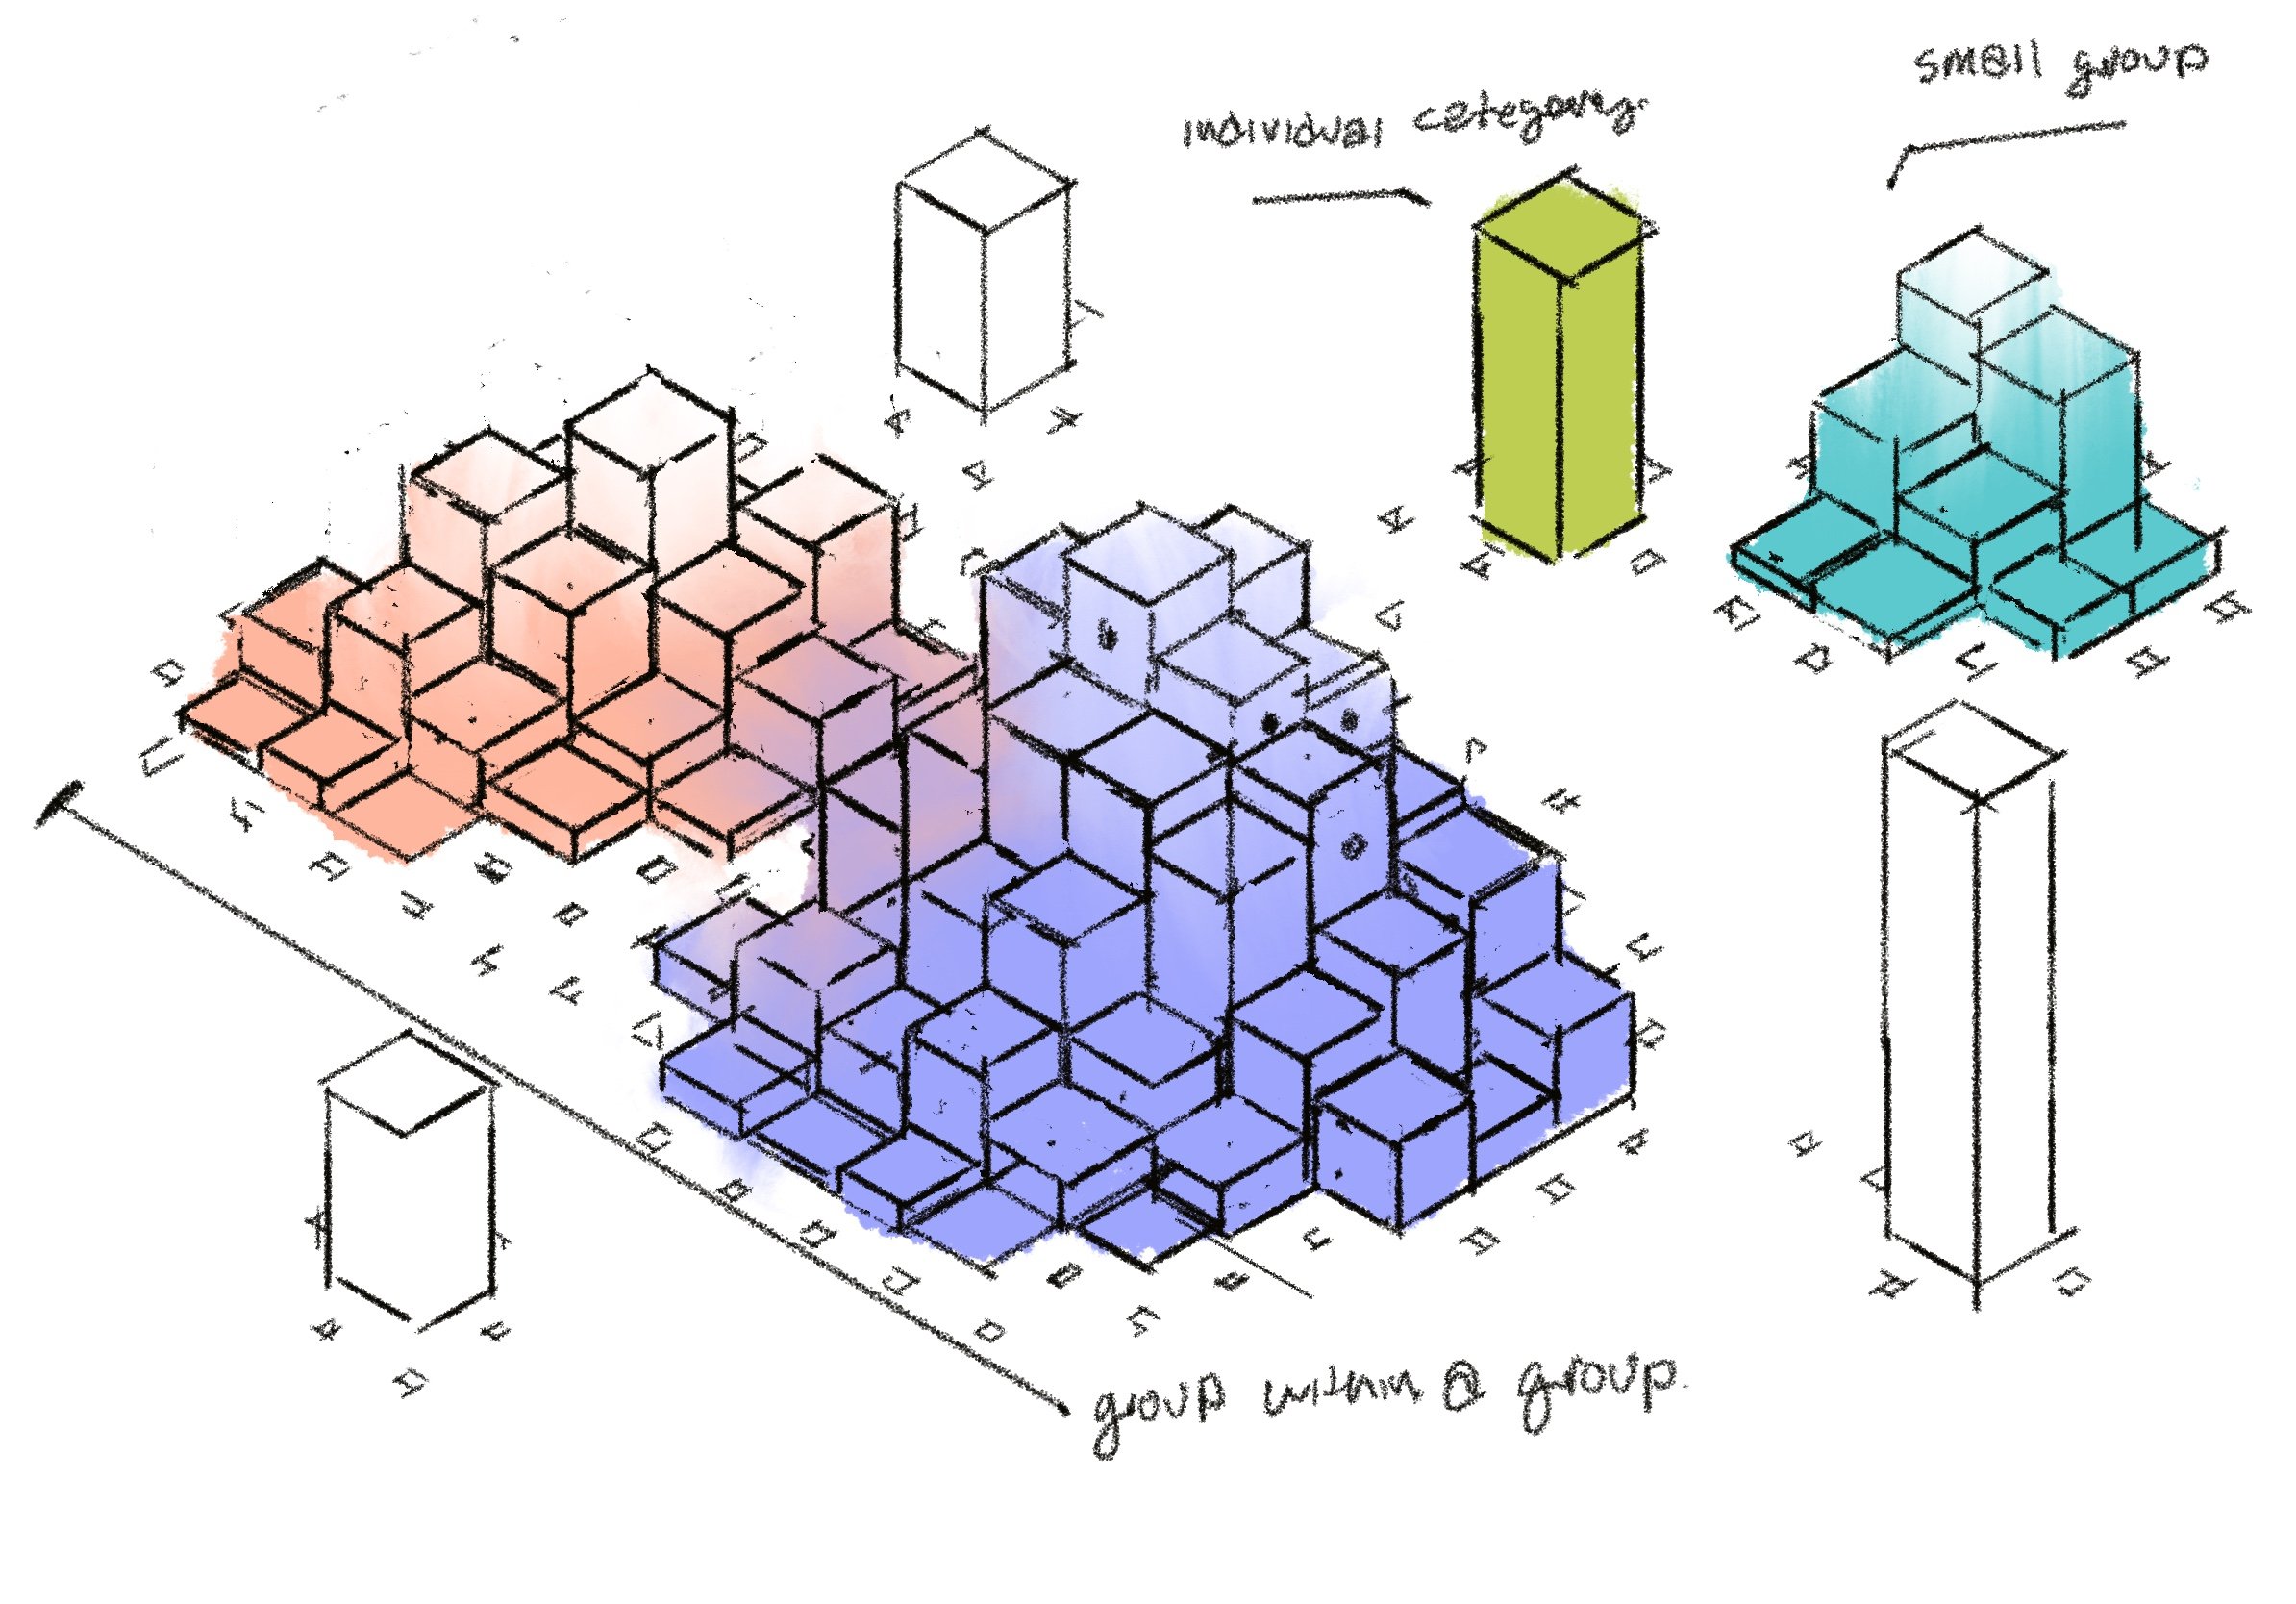
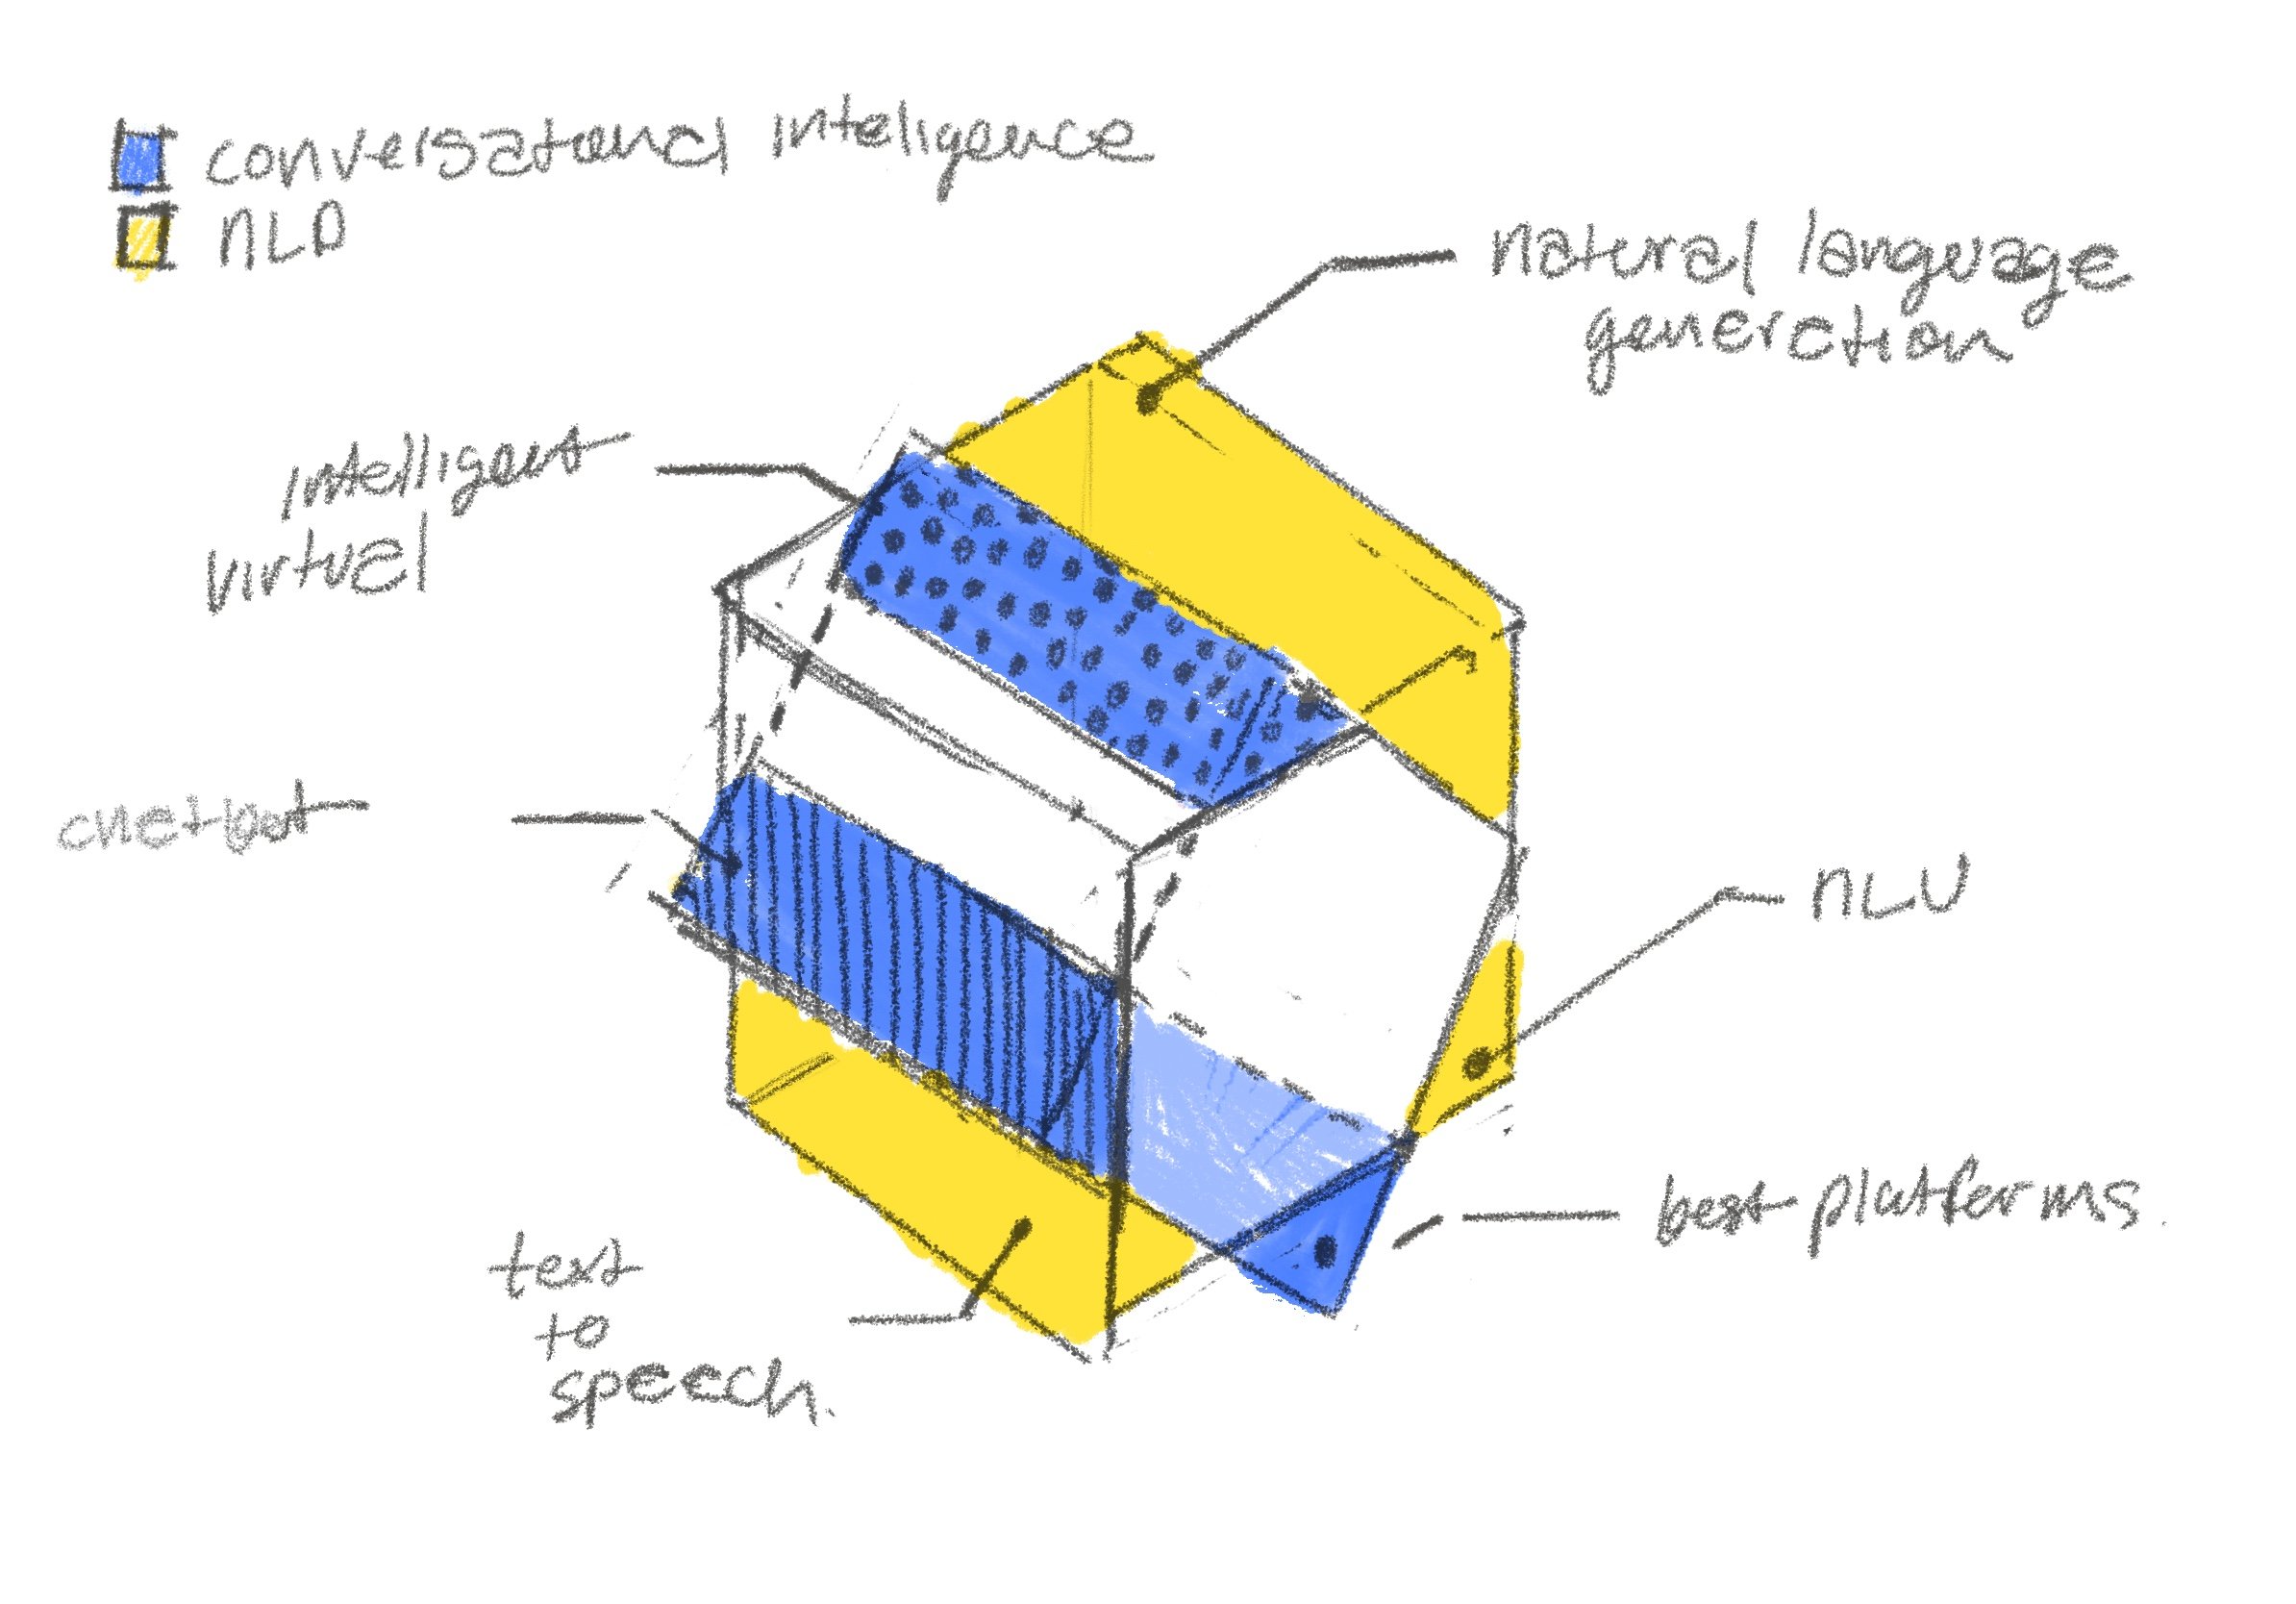
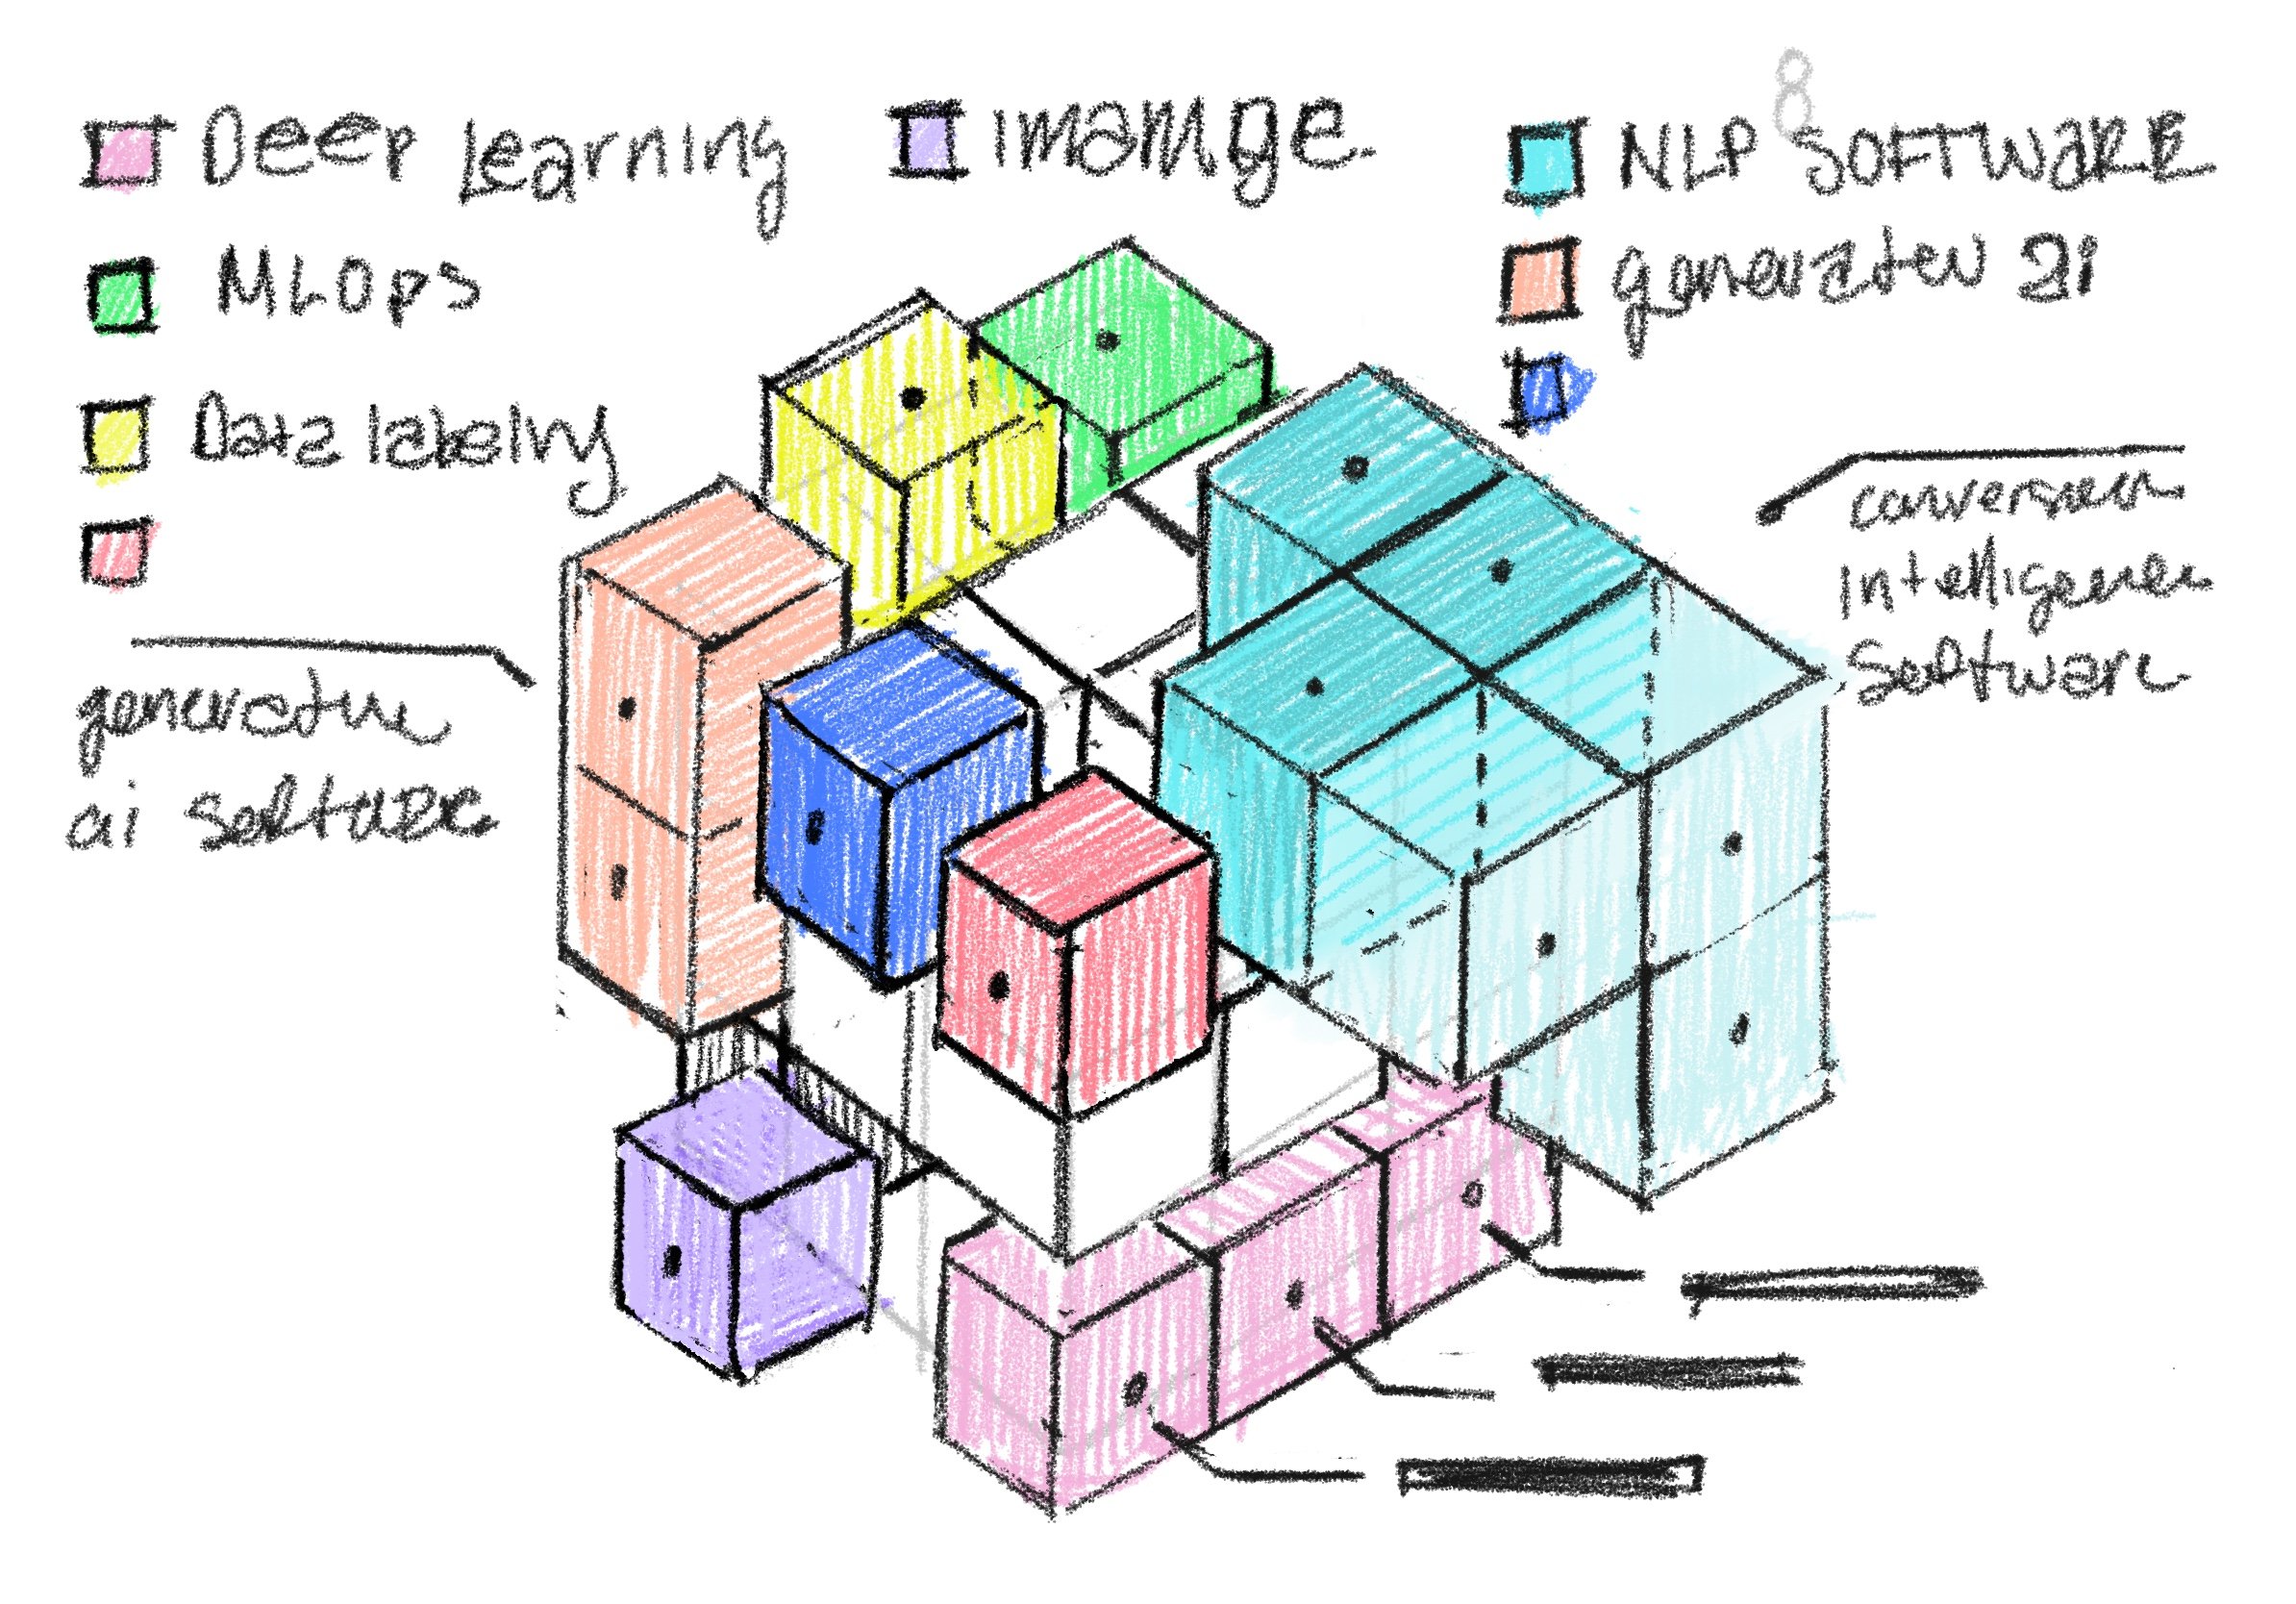
Visualizing the hierarchy of AI software categories and their relation to each other. Groups nested within another group.
Designing to Scale
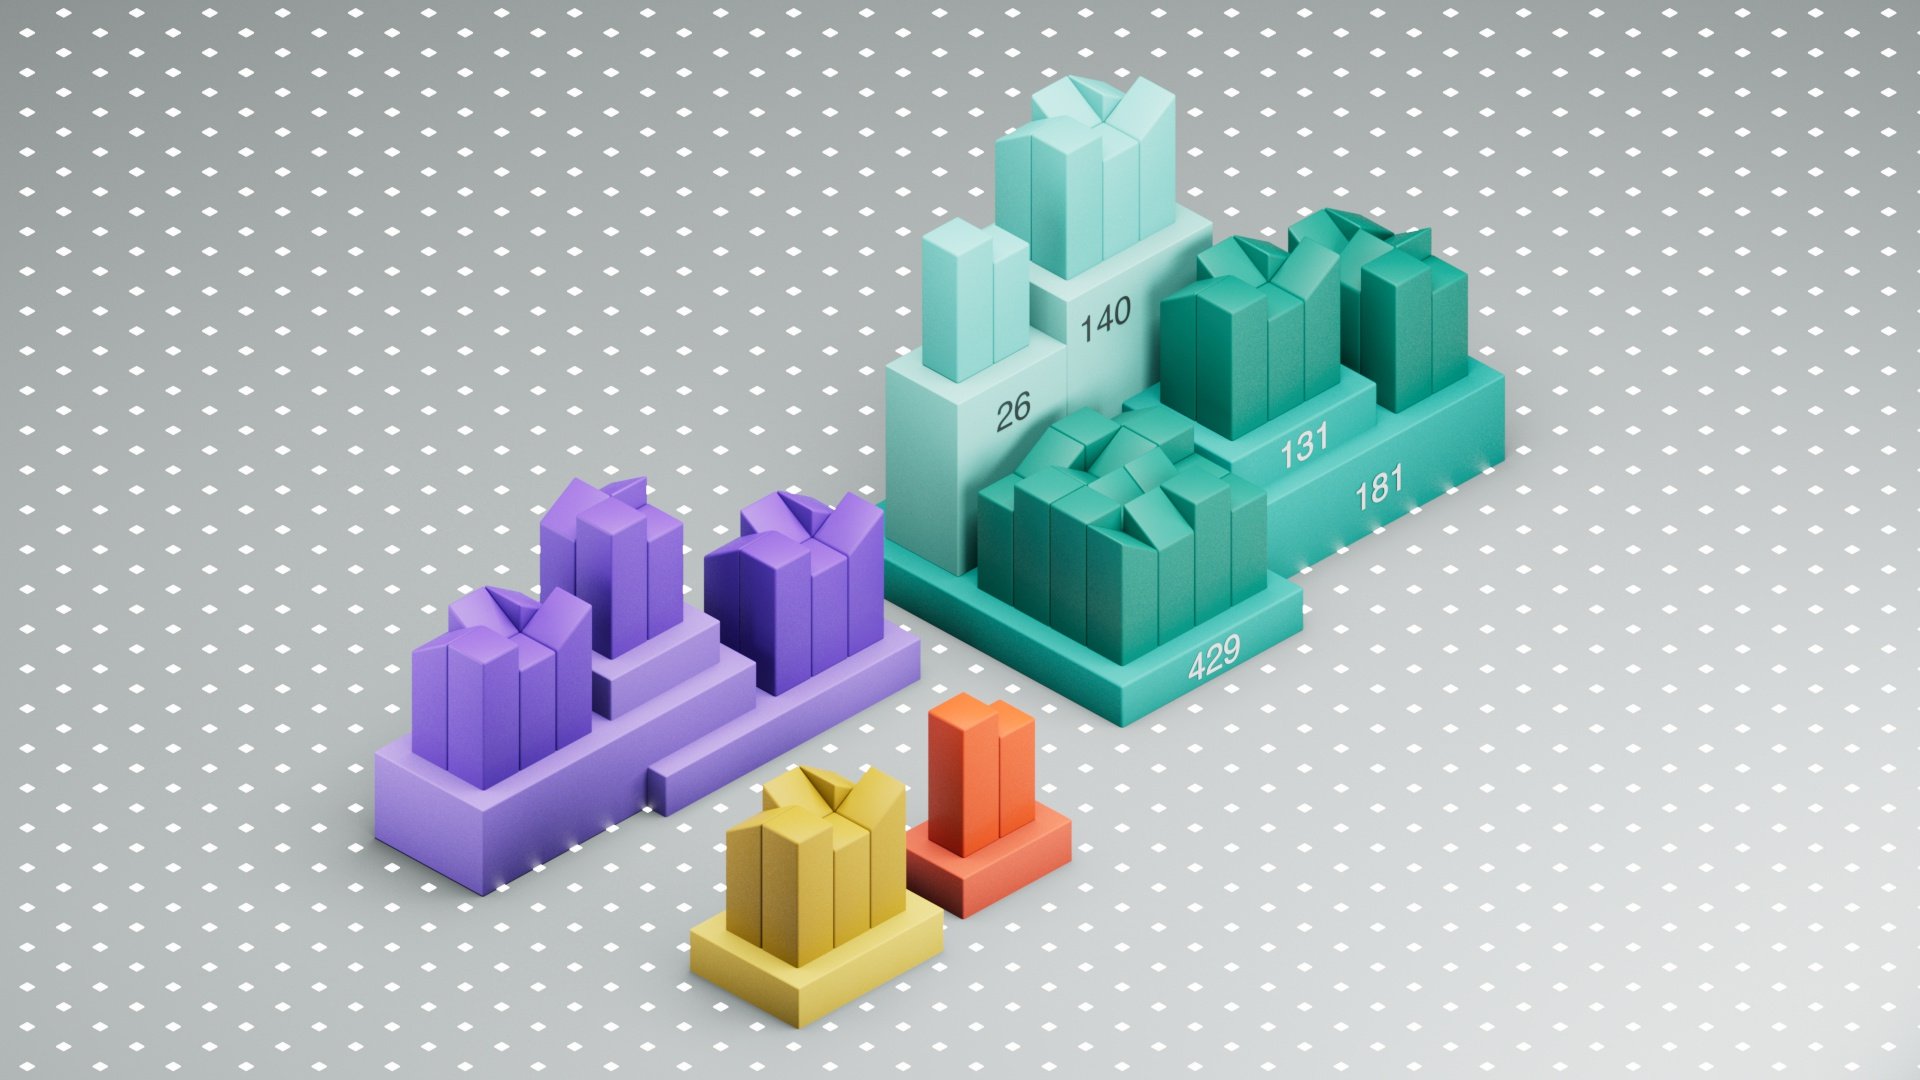
This not only simplifies the visual complexity of the chart but allows for it to be more accurate for a longer period before updating with new numbers.
Designing the variables
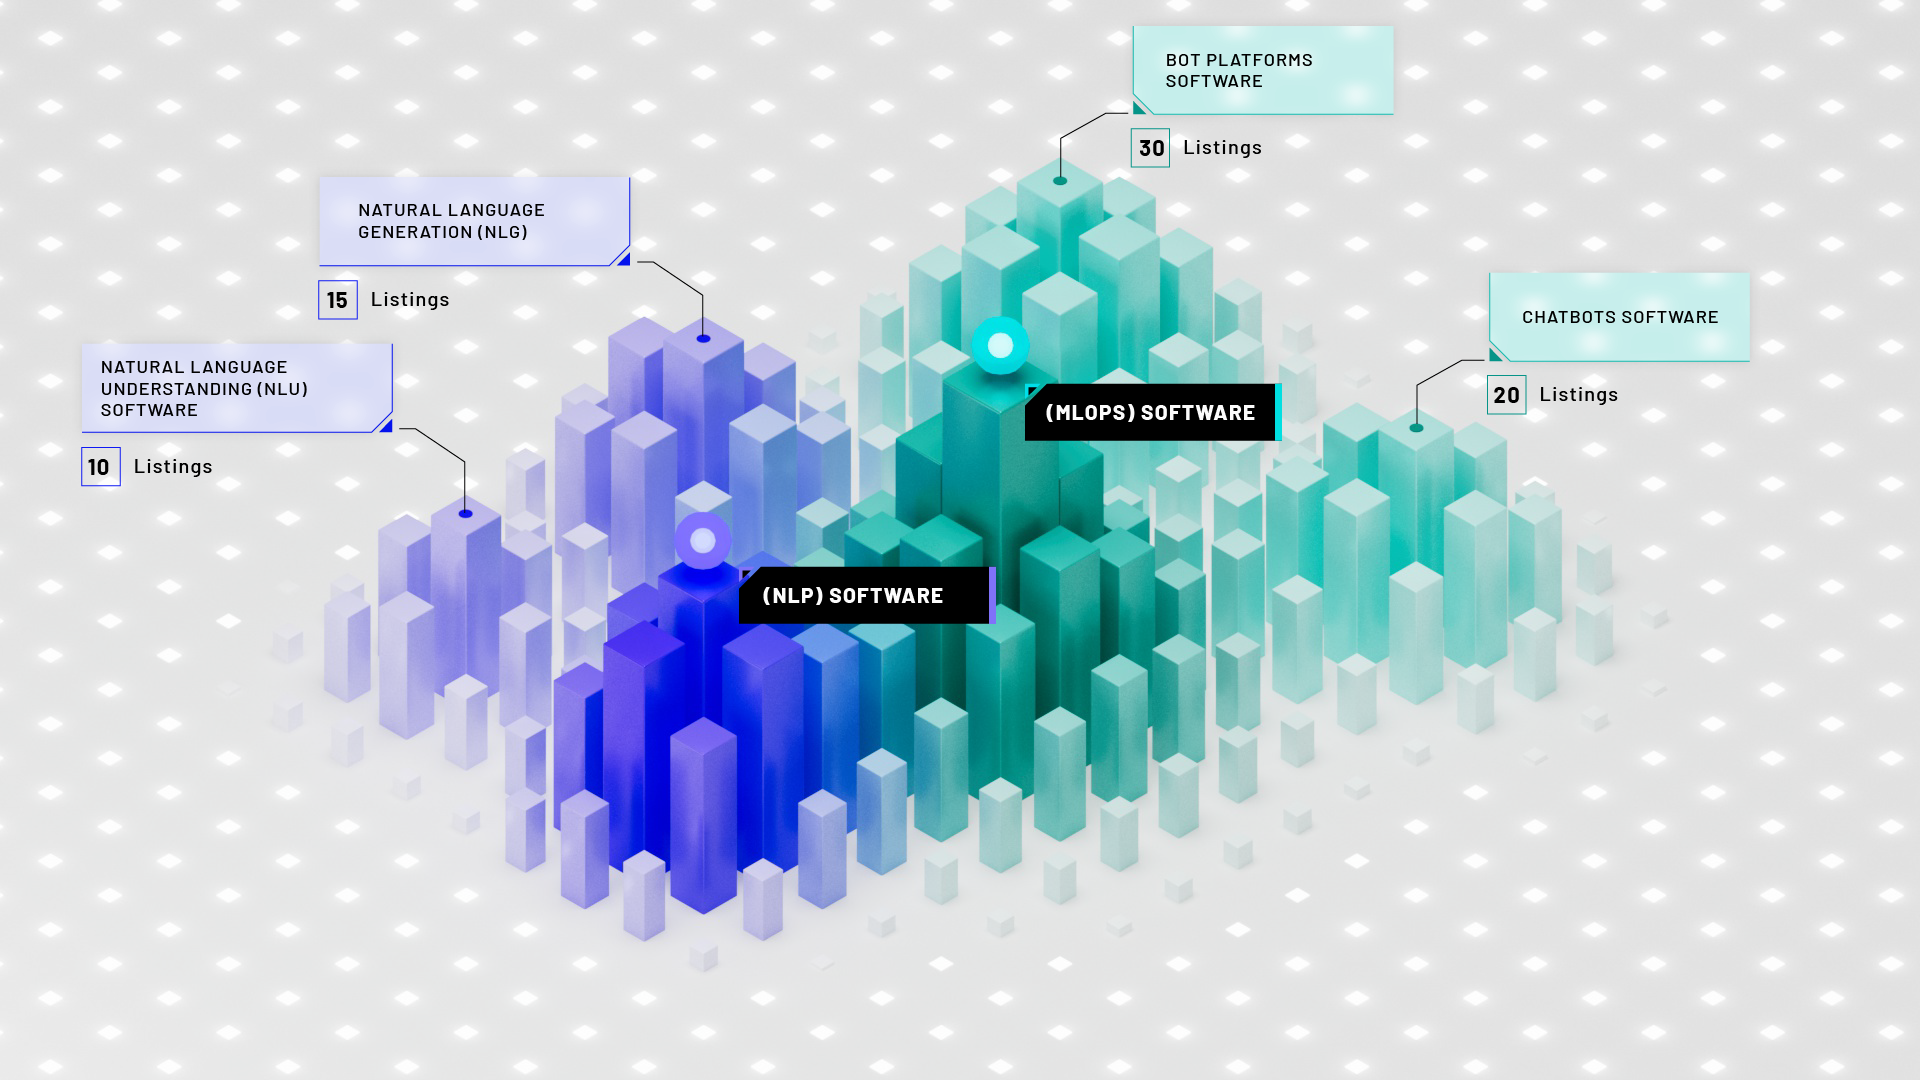
Like a metropolis is designed, each parent category branches off into smaller connected categories. Using Area To represent the amount of products in a category. and the height of the buildings represents the speed of growth.
Initial concept animation and map design. Creating an organically shaped group of building clusters that gradient into one another. This shows the fluidity in which listings are categorized and relate to other categories.
Individual Categories
In this module I designed a user can explore more information about each category and compare the amount product listings.
All Ai software Categories
Viewing the entire AI taxonomy to compare what categories are more populated than others.
DeSigning A heat map overlay for search Volume
An interactable filter on the map that allows a user to view another layer of information about the search volume. This is helpful for investors to quickly see what categories are being talked about most.


